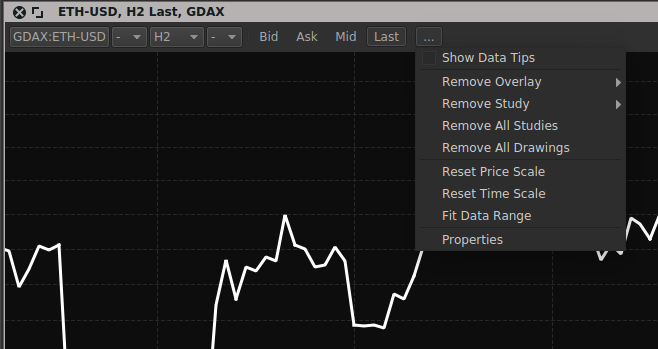
Chart Toolbar

_images/chart-toolbar.png
From left to right:
  1. Symbol - the chart symbol, when clicked the Symbol Search window is displayed

  2. Symbol Link - the channel used for symbol linking

  3. Interval - the charts interval

  4. Interval Link - the channel used for interval linking

  5. Bid, Ask, Mid, Last - used to select the price field to display

    • For Forex and CFD instruments Bid, Ask, and Mid are available

    • For Stocks and Cryptos only Last is available

    • For Indices, Mid and/or Last may be available depending on the calculation (if quote or trade data is used)

    If you switch to a symbol that doesn’t support the active price field the first available field is auto-selected.

  6. The More Menu

The More Menu menu items

Show Data Tips

Toggle the chart property of the same name, see Chart Properties window

Remove Overlay and Remove Study menus

Contains a listing of all the attached overlays or studies, clicking a study’s menu item will remove it from the chart

Remove All Studies

Removes all the studies

Remove All Drawings

Removes all the drawings that were drawn on the charts current symbol

Reset Price Scale

Fits the visible price data and switches on auto scale

Reset Time Scale

Sets the default bar width

Fit Data Range

Squashes the width of the bars to fit all the loaded data into view

Properties

Opens the Chart Properties window