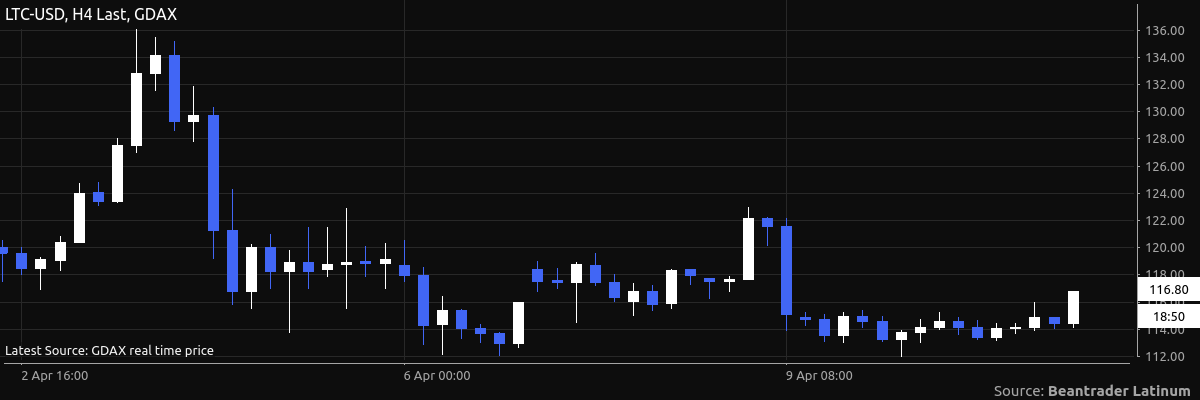
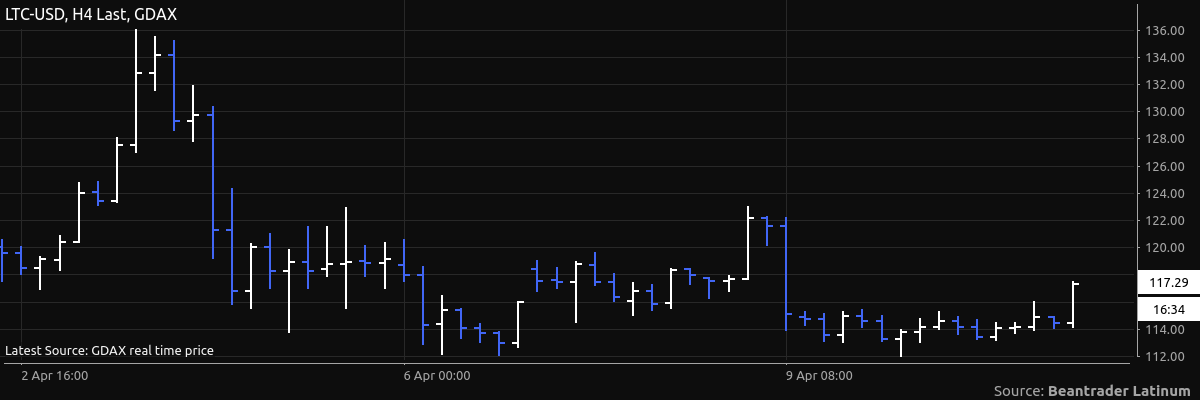
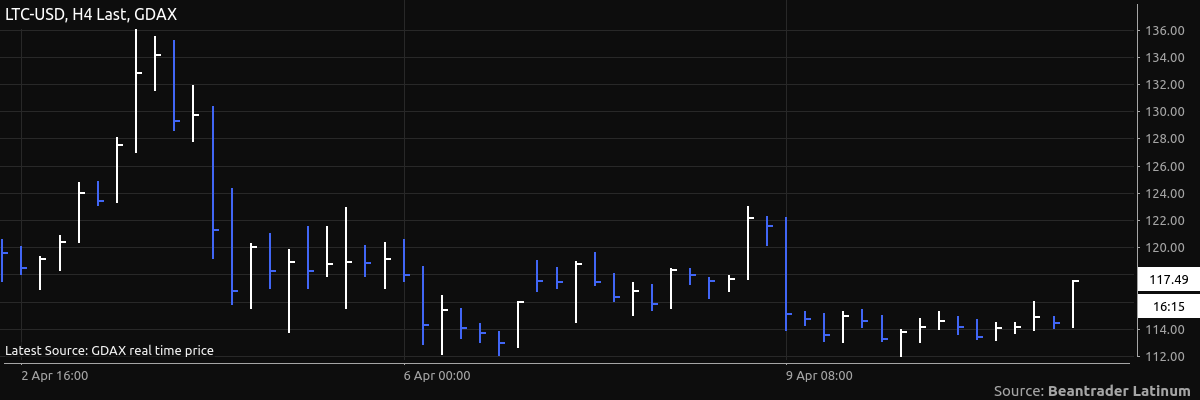
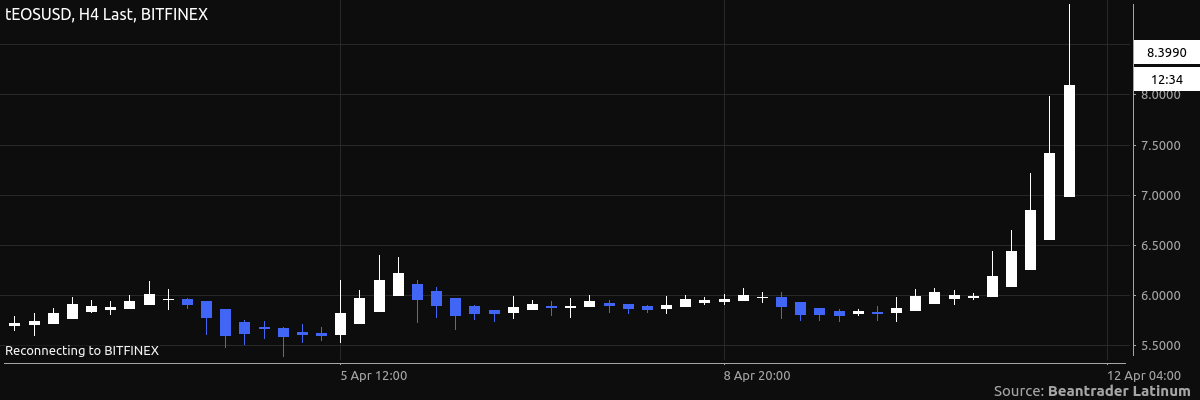
Chart Types

Candlestick

_images/candlestick.png

Displays the Open, High, Low, and Close price.

Candlestick Trend

_images/candlestick-trend.png

Displays the Open, High, Low, and Close price. The previous candle is used when determining color.
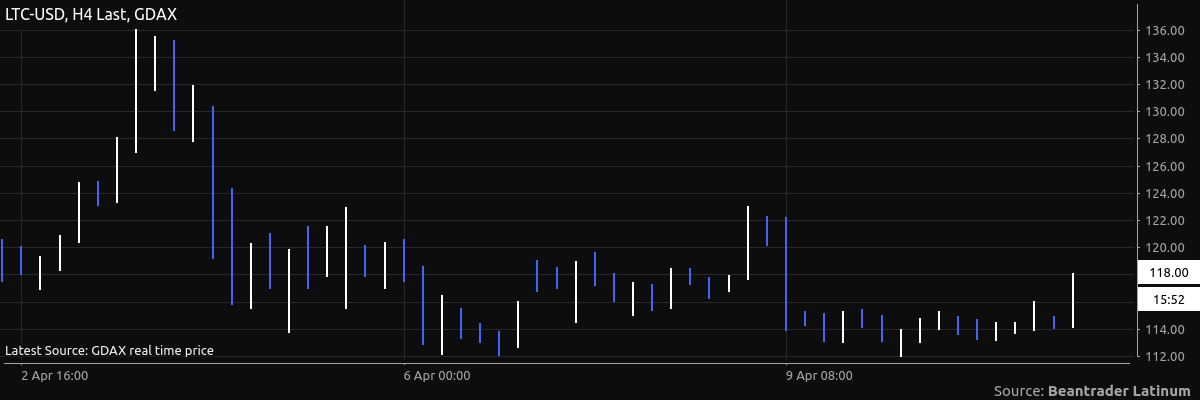
Coloring algo

Hollow Candlestick

_images/hollow-candlestick.png

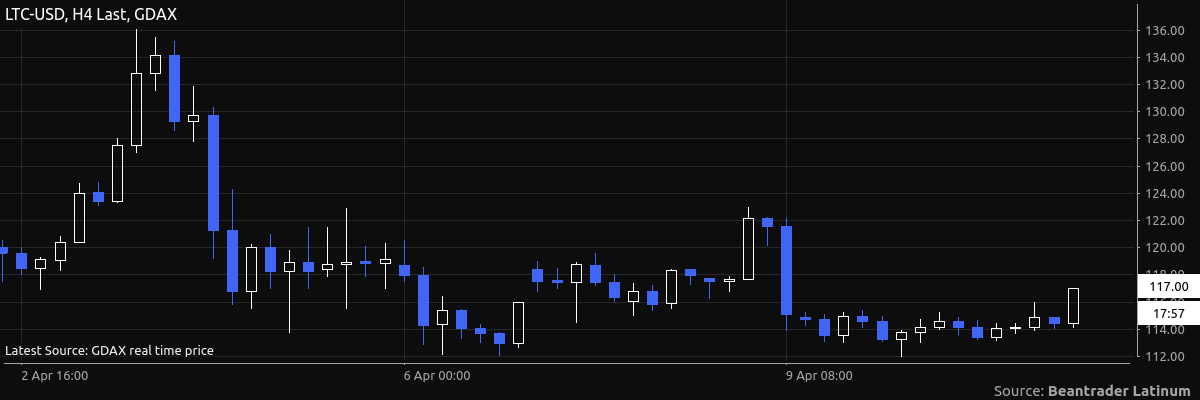
Displays the Open, High, Low, and Close price. Bullish bars are hollow, bearish bars are filled.
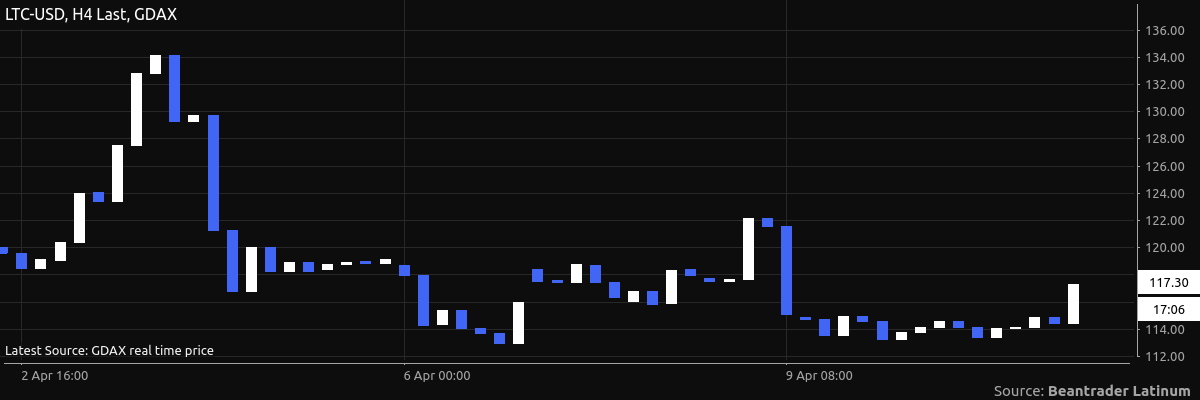
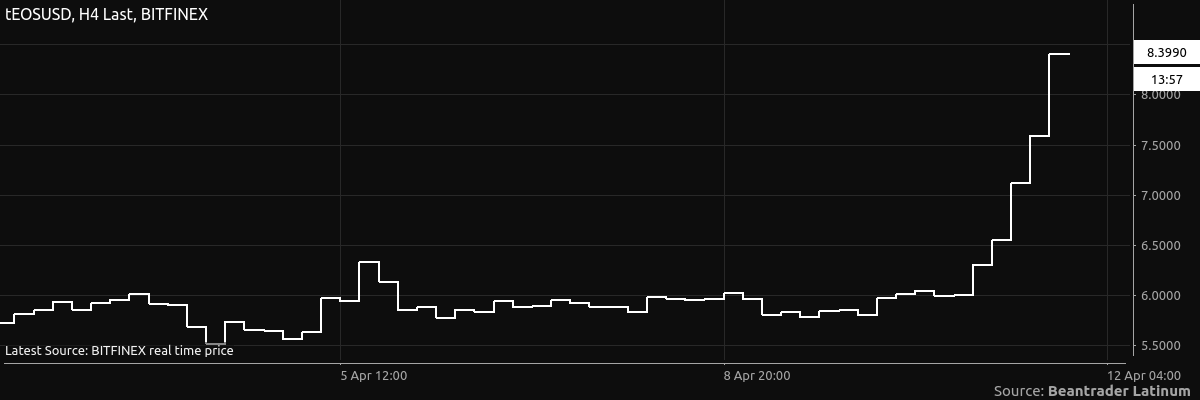
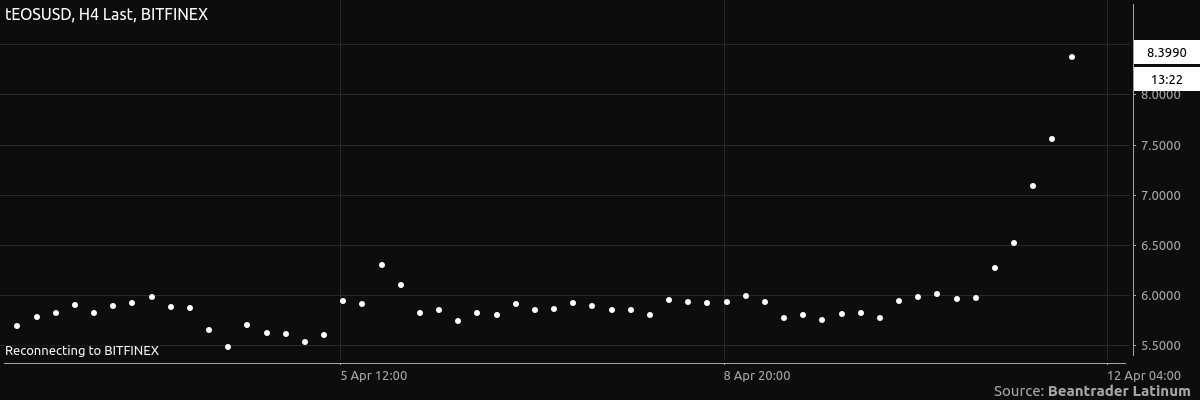
Real Body

_images/real-body.png

Displays the Open and Close price.

OHLC

_images/ohlc.png

Displays the Open, High, Low, and Close price.

HLC

_images/hlc.png

Displays the High, Low, and Close price.

HL

_images/hl.png

Displays the High and Low price.

Area

_images/area.png

Displays the Close price. The area from the baseline (zero) to the price is filled.

Line

_images/line.png

Displays the Close price.

Colored Line

_images/colored-line.png

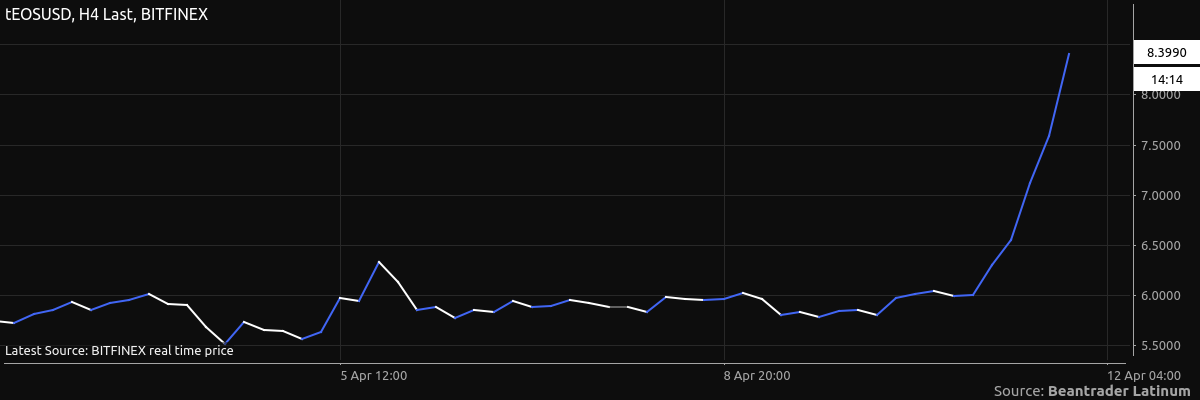
Displays the Close price. The line segments between each point are colored based on increase or decrease in price.
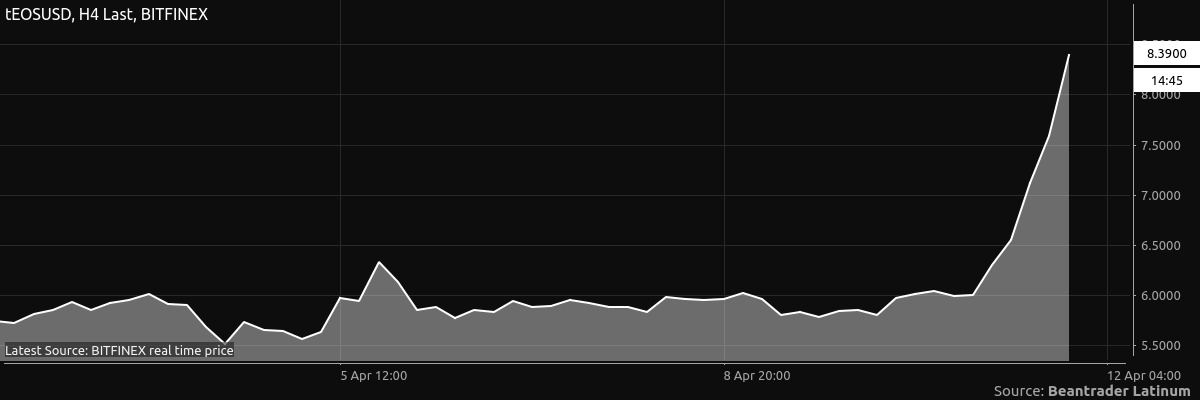
Step

_images/step.png

Displays the Close price.

Histogram

_images/histogram.png

Displays the Close price.

Dots

_images/dots.png

Displays the Close price.

Invisible

_images/invisible.png

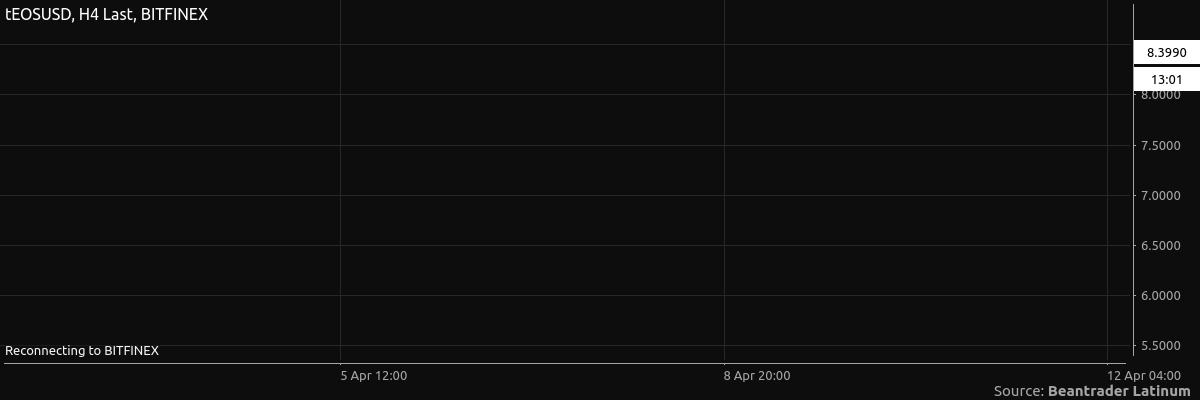
Displays nothing. Use this if you have a study applied and are not interested in the price.
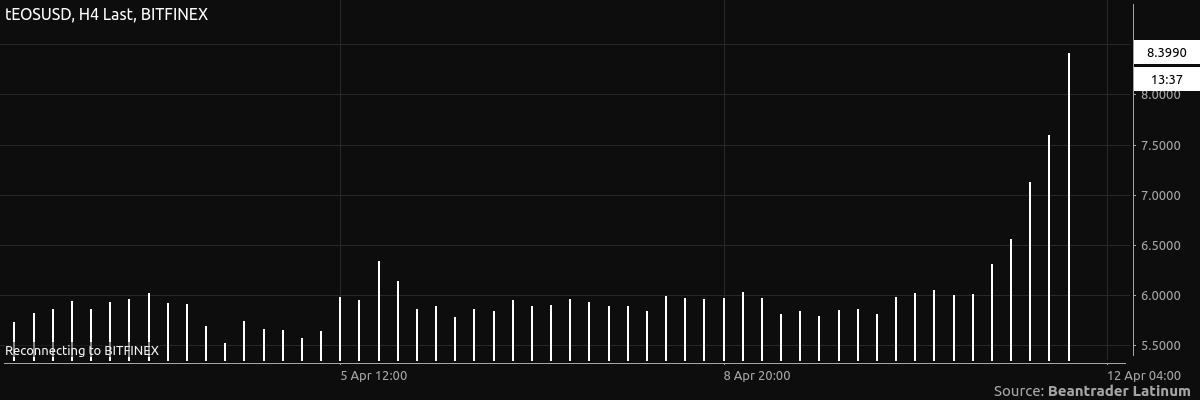
Heikin-Ashi

_images/heikin-ashi.png

Displays an averaging of current and previous bars.

Column

_images/column.png

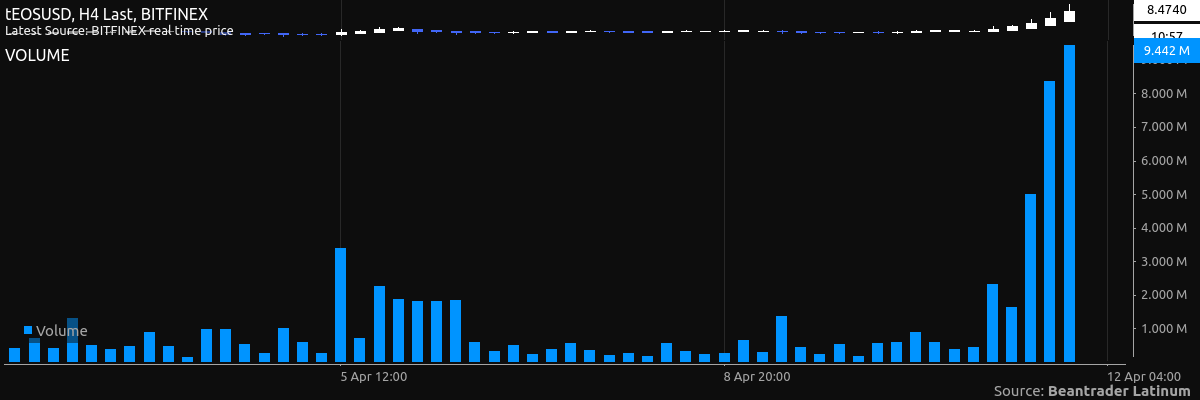
Displays values in columns, similar to Histogram but Column have width.

Only used by studies